PJM’s record-high capacity price is a substantial expense that will significantly inflate business energy bills. For example, an organization that paid around $5,300 in capacity charges for 2024/2025 could face $60,000+ annually starting June 1, 2026.
Here’s how the increased cost impacts you and the steps you should be considering now.
Let’s look at a real-world example. A business that paid around $5,366 per year in capacity charges for 2024/2025, could ultimately see their costs jump to over $60,000 annually starting June 1, 2026. That’s more than a 1000% increase, and it’s not hypothetical. This is directly tied to the business’s Peak Load Contribution (PLC) tags—which represent their share of the grid’s demand during peak periods. As capacity prices rise, the financial burden scales proportionally with the PLC value.
Independent of the size of a business, managing usage during peak periods is important. While it’s not possible to control the capacity rate, load curtailment and shifting strategies provide a way to minimize the impact of increased capacity rates.
Let’s break down how...
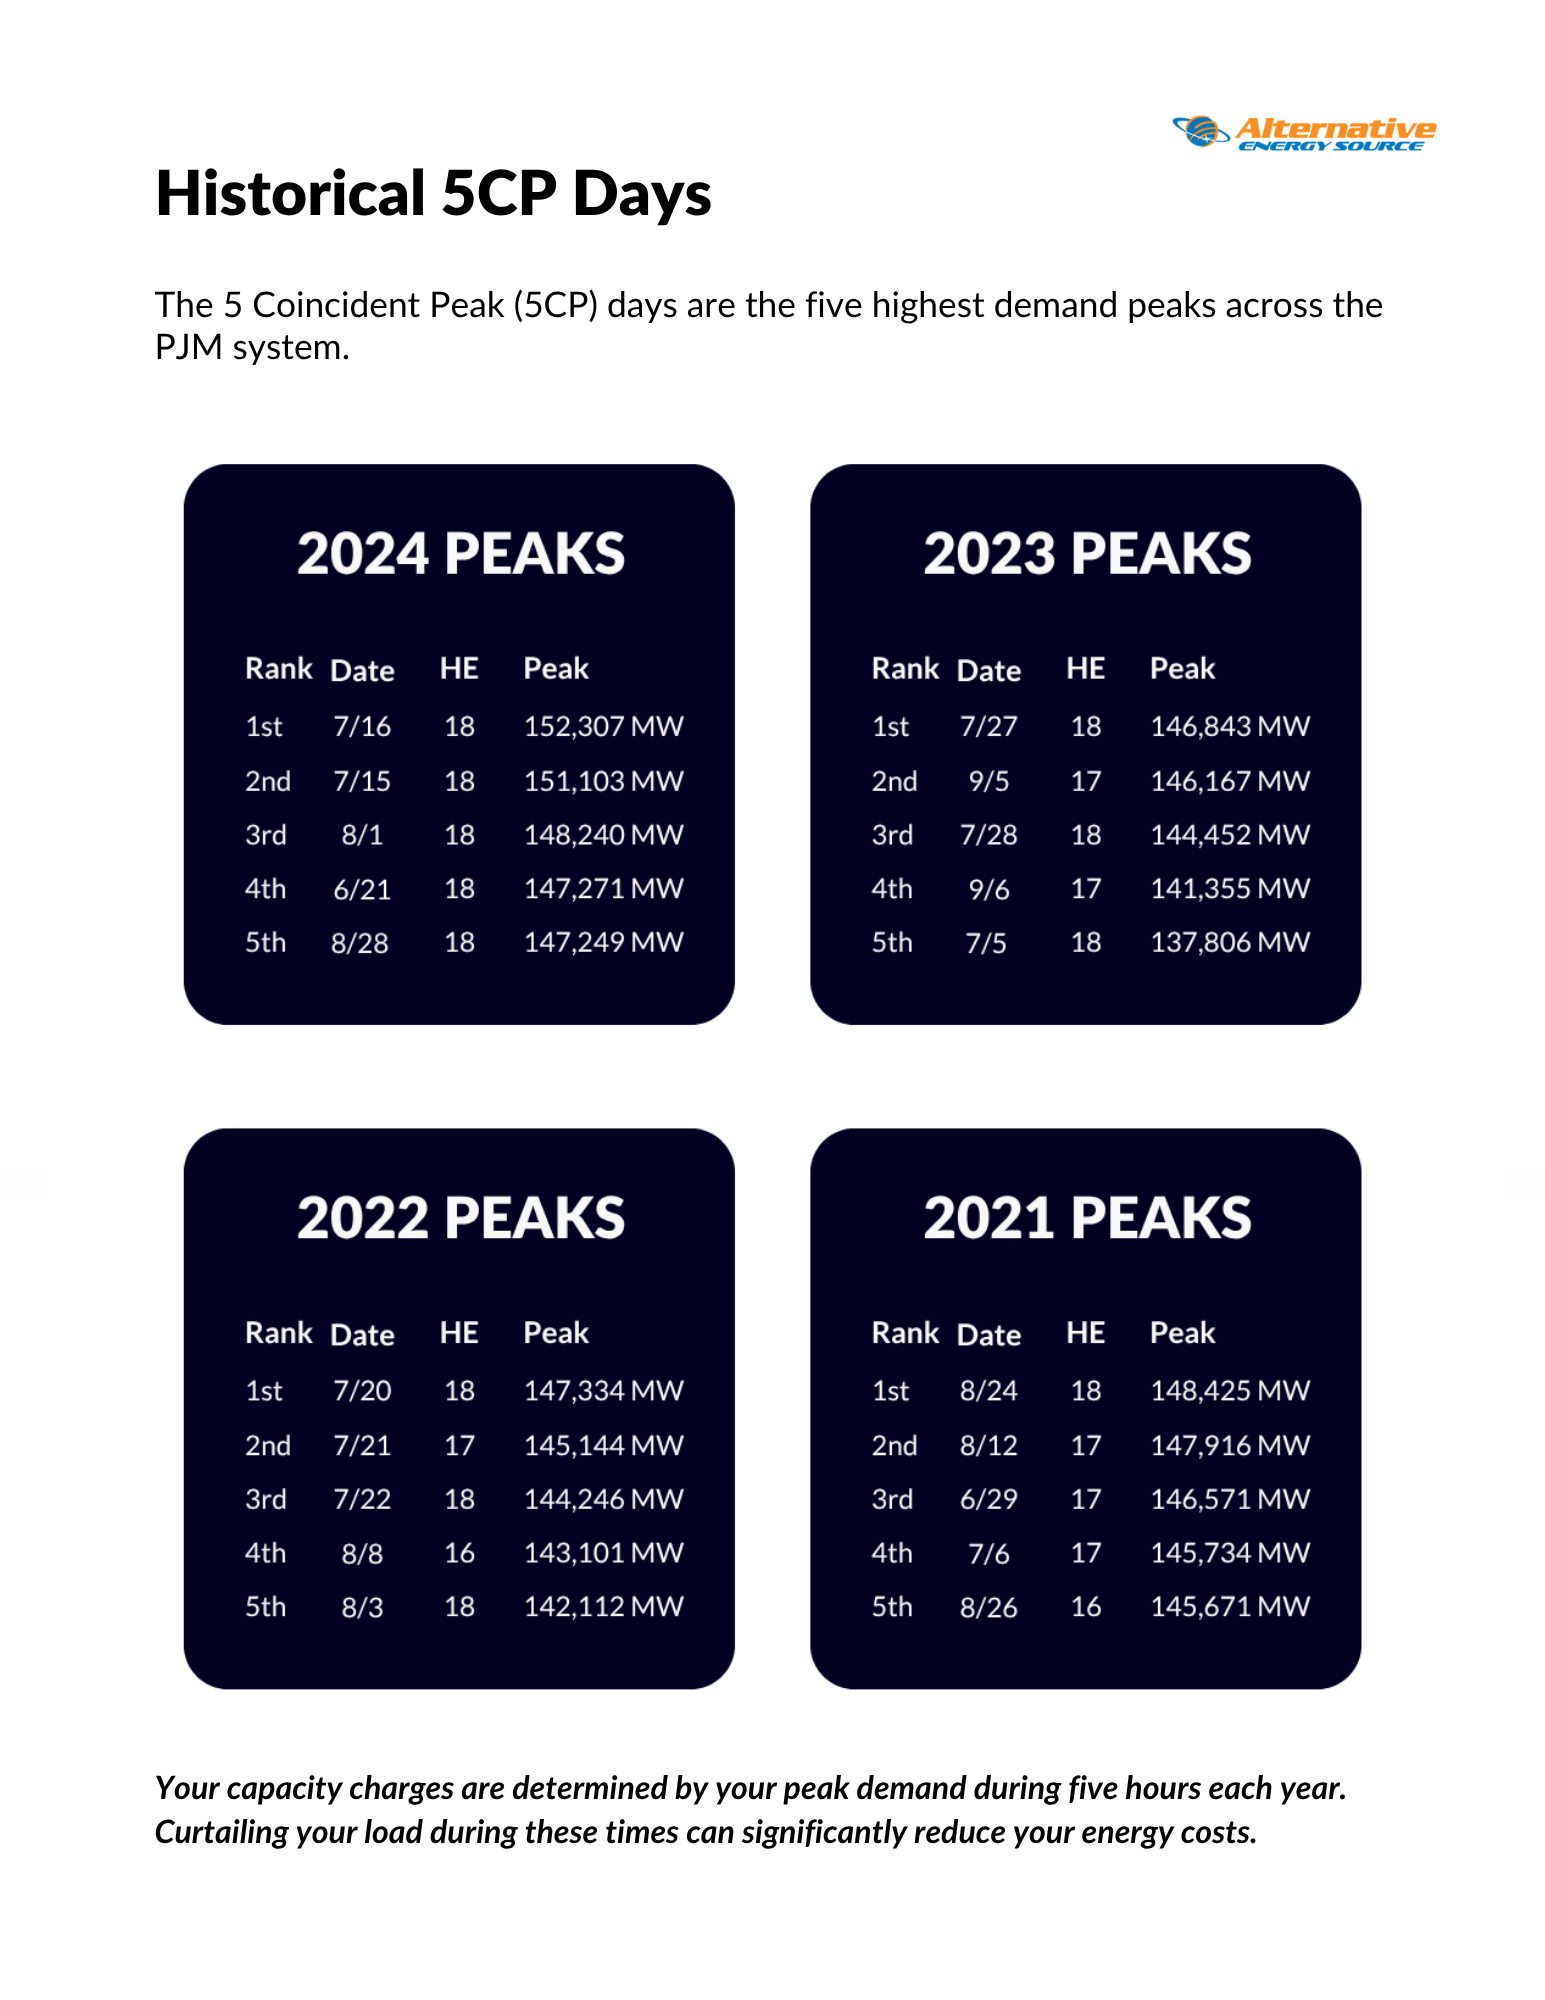
A business’s capacity costs are calculated by multiplying (1) their peak load contribution times (2) the capacity rate set by PJM’s annual capacity auction.
PJM determines a business's capacity tag based on its peak load contribution (PLC).
Successful load management strategies executed in the current year will impact capacity costs the following year, June 1 to May 31.
To protect grid reliability during periods of high demand, PJM runs an annual capacity auction to secure commitment for power generation sufficient to meet forecasted demand.
Once PJM reserves the necessary power, the resulting cost is shared by companies that provide electricity, called Load Serving Entities (LSEs). The cost, called the Locational Reliability Charge (LRC) goes to power suppliers for making electricity available when needed.
For the 2026/2027 planning year the capacity rate is $329.17/MW-day.
From $5,366 to $60,000: A Real Cost Example
The following example assumes a peak load contribution of 500 kW.
2026/2027: $329.17/MW-day × 0.5 MW (500 kW) × 365 days = $60,074/yr for June 1, 2026 - May 31, 2027
2025/2026: $269.92/MW-day × 0.5 MW (500 kW) × 365 days = $49,260/yr for June 1, 2025 - May 31, 2026
2024/2025*: $29.40/MW-day × 0.5 MW (500 kW) × 365 days = $5,366/yr for June 1, 2024 - May 31, 2025
*2024-2025 prices for AEP, DP&L, Duke, and FE markets.
The Auction Price is Locked In. PJM’s clearing price of $329.17/MW-day will set capacity rates June 1, 2026, through May 31, 2027.
Capacity Costs Are Volume-Based. Businesses that can strategically lower their demand during system peaks can reduce their PLC tags and therefore their capacity charges.
The Market Pressures Persist. PJM’s tight supply-demand balance is expected to continue. As such, this year’s price spike is simply a sign of future trends.
The good news? You still have time to influence your future capacity charges.
Understanding your PLC exposure and implementing a proactive load management strategy can yield cost savings.
Here’s how businesses are responding:
Proven Strategies to Offset Your PJM Capacity Costs
Ten Ways to Control Your Business Capacity Costs